Pacote gilmoregirls
Autora e mantenedora do pacote gilmoregirls
By Luisa Gisele Böck in Pacotes
June 26, 2022

O pacote gilmoregirls disponibiliza as informações de todos os episódios do seriado Gilmore Girls.
Exemplo:
gilmoregirls::gilmoregirls_info |>
  dplyr::glimpse()
## Rows: 153
## Columns: 10
## $ index <int> 1, 2, 3, 4, 5, 6, 7, 8, 9, 10, 11, 12, 13, 14, 15, 1…
## $ season <int> 1, 1, 1, 1, 1, 1, 1, 1, 1, 1, 1, 1, 1, 1, 1, 1, 1, 1…
## $ episode <int> 1, 2, 3, 4, 5, 6, 7, 8, 9, 10, 11, 12, 13, 14, 15, 1…
## $ title <chr> "Pilot", "The Lorelais' First Day at Chilton", "Kill…
## $ directed_by <chr> "Lesli Linka Glatter", "Arlene Sanford", "Adam Nimoy…
## $ written_by <chr> "Amy Sherman-Palladino", "Amy Sherman-Palladino", "J…
## $ air_date <chr> "October 5, 2000 ", "October 12, 2000 ", "October 19…
## $ us_views_millions <dbl> 5.03, 3.40, 2.89, 3.93, 3.88, 3.73, 3.45, 3.80, 3.62…
## $ imdb_rating <dbl> 8.1, 8.0, 7.8, 7.9, 7.8, 8.5, 8.4, 8.1, 8.7, 8.3, 7.…
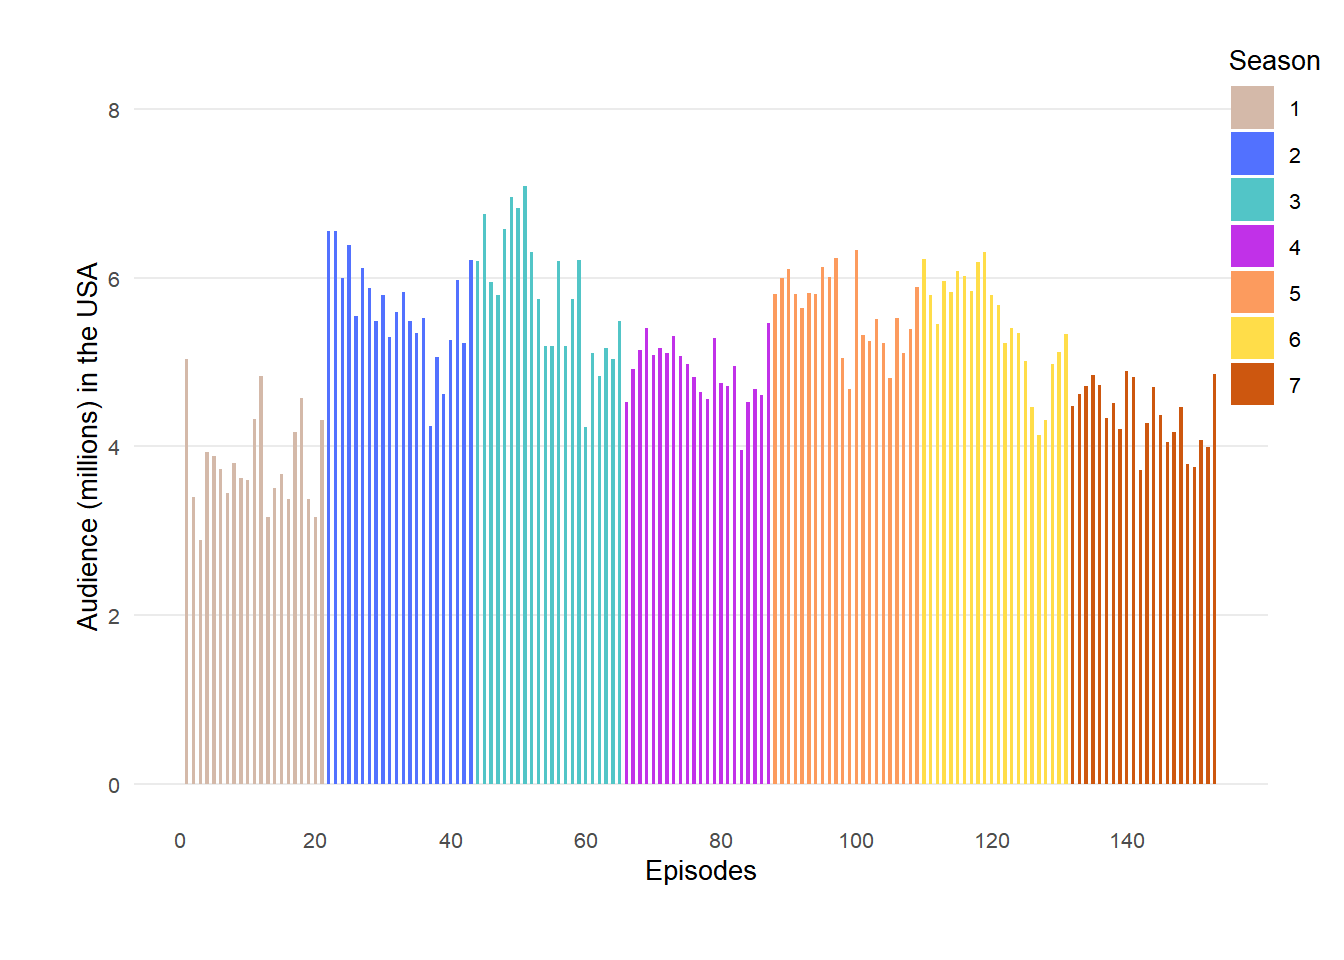
## $ description <chr> "Rory is accepted into the elite Chilton prep school…gilmoregirls::gilmoregirls_info |>
dplyr::mutate(season = as.factor(season)) |>
ggplot2::ggplot() +
ggplot2::aes(
x = index,
y = us_views_millions,
fill = season,
width = 0.5
) +
ggplot2::geom_col() +
ggplot2::labs(
x = "Episodes",
y = "Audience (millions) in the USA",
fill = "Season"
) +
ggplot2::scale_x_continuous(breaks = seq(0, 153, 20)) +
ggplot2::scale_y_continuous(
limits = c(0, 8),
breaks = seq(0, 8, 2)
) +
ggplot2::scale_fill_manual(
values = c(
"#d4b9a9",
"#5271ff",
"#52c5c7",
"#c131e8",
"#fc9b5e",
"#ffdd49",
"#cd570f"
)
) +
ggplot2::theme_minimal() +
ggplot2::theme(
panel.grid.major.x = ggplot2::element_blank(),
panel.grid.minor = ggplot2::element_blank(),
legend.position = c(1.06, 1.06),
legend.justification = c("right", "top"),
legend.box.just = "right",
plot.margin = ggplot2::unit(c(1, 1, 1, 1), "cm"),
text = ggplot2::element_text(size = 10)
)